
Correlation: Does Order Matter?
This site utilizes Google Analytics, Google AdSense, as well as participates in affiliate partnerships with various companies including Amazon. Please view the privacy policy for more details.
One of the more interesting and important parts of studying two different sets of data is to see if they are correlated. It might make one wonder if the order of the data matters. In this blog post, I show with three different methods - by an empirical example, by looking at the correlation function, and visually - why the order doesn’t matter so long as each data point is matched to the same datapoint each time.
Empirical Examples of Correlation Order
I took the following table and checked the correlation of the first column to each of the other columns.
| x | 2x | x^2 | rand | randx | 2randx | rand2x |
|---|---|---|---|---|---|---|
| 0 | 0 | 0 | 0.929583627 | 0 | 0 | 0 |
| 1 | 2 | 2 | 0.106796718 | 0.446658011 | 0.528395381 | 0.619822838 |
| 2 | 4 | 8 | 0.965680581 | 0.558912516 | 2.54093125 | 1.828189598 |
| 3 | 6 | 18 | 0.414864737 | 0.687537491 | 5.138625559 | 4.390020628 |
| 4 | 8 | 32 | 0.281896948 | 1.435247716 | 12.22423024 | 9.742716442 |
| 5 | 10 | 50 | 0.991283219 | 1.946204896 | 24.84904045 | 19.60735842 |
| 6 | 12 | 72 | 0.209942889 | 2.753579488 | 50.48208289 | 39.39509331 |
| 7 | 14 | 98 | 0.069575289 | 3.300250238 | 102.0477535 | 79.71388555 |
| 8 | 16 | 128 | 0.21872816 | 3.659157949 | 205.9436615 | 160.0289991 |
| 9 | 18 | 162 | 0.371072841 | 4.449775914 | 412.9537101 | 320.2597064 |
| 10 | 20 | 200 | 0.644162181 | 5.011163213 | 827.1657248 | 640.7804415 |
I got the correlation values of 1, 0.963142661, -0.289999765, 0.988187371, 0.774789519, and 0.775376284, respectively. I then sorted the entire table by the various columns, but the correlation never changed. However, when I sorted each column independently, the correlation did in fact change.
Let’s dig a little deeper as to why by looking into the correlation function.
The Correlation Function
The correlation function of x and y is defined as the covariance of x and y divided by the product of the standard deviations of x and y:
correlation(x,y) = covariance(x,y)/std(x)std(y)
This means, as described on the Math Is Fun webpage, we only need to know a few things: the sum of x, y, x^2, y^2, and xy. Intuitively, and perhaps by experience, we know that the order by which we sum numbers does not affect the result. This is also a basic mathematical concept known as the associative property of addition.
But why does changing the order of one column matter?
Because we also need to know the sum of xy - that is, it’s not so much the order of the column, but the pairings that matter. If we take this very basic example:
| x | y | xy |
|---|---|---|
| 0 | 0 | 0 |
| 1 | 2 | 2 |
| 2 | 4 | 8 |
| 3 | 6 | 18 |
| 4 | 8 | 32 |
| 5 | 10 | 50 |
| 6 | 12 | 72 |
| 7 | 14 | 98 |
| 8 | 16 | 128 |
| 9 | 18 | 162 |
| 10 | 20 | 200 |
| sum | 770 |
We see that reversing the order of y messes with the (x,y) pairings, making the results different:
| x | y | xy |
|---|---|---|
| 0 | 20 | 0 |
| 1 | 18 | 18 |
| 2 | 16 | 32 |
| 3 | 14 | 42 |
| 4 | 12 | 48 |
| 5 | 10 | 50 |
| 6 | 8 | 48 |
| 7 | 6 | 42 |
| 8 | 4 | 32 |
| 9 | 2 | 18 |
| 10 | 0 | 0 |
| sum | 330 |
Visually and Conceptually Comparing Correlation Order
Finally, we look into what correlation is trying to tell us why order doesn’t matter so long as the variables remained paired with one another.
A correlation of 1 means that there is a linear relationship between the variables, whereas a correlation of -1 means that there is an inverse linear relationship between the variables. Visually, this means if you plotted each pair of points in either case and connected the dots, then you would have a straight line.
The closer to the correlation is to zero, the less of a line is formed.
Here are the above examples plotted:
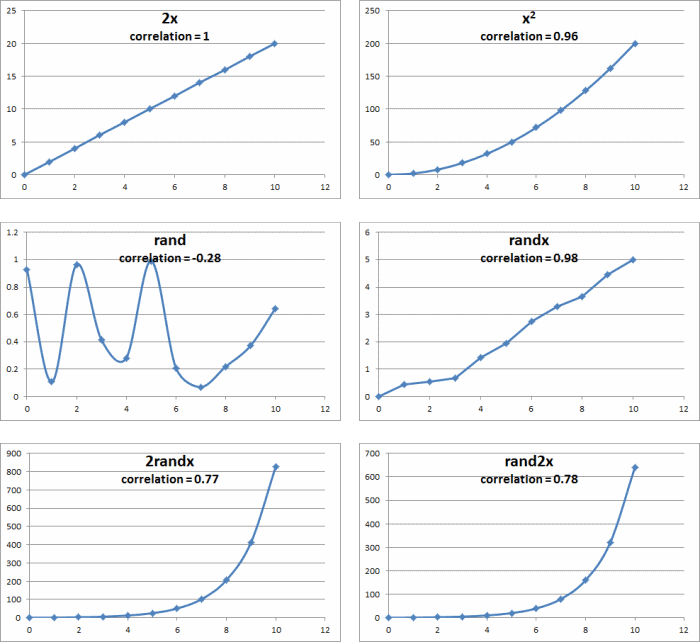 Plotted Correlation Examples
You can imagine if that if the x was sorted without regard to y, or vice versa, the graphs would look very different. However, it doesn’t matter which dot you drew first. The same is true for their correlations.
2 comments for Correlation: Does Order Matter?
Leave a Reply

After a long day of working in corporate finance, this is a little too much data analysis for me ;)
Reply to This Thread
Interesting. It kind of goes over my head, but it makes me wonder about practical applications.
Reply to This Thread