Is Technology Accelerating? An Analysis of US Patent Records
This site utilizes Google Analytics, Google AdSense, as well as participates in affiliate partnerships with various companies including Amazon. Please view the privacy policy for more details.
Technology keeps progressing faster and faster. It’s accelerating. Or so I’m told. But is it really? How can we tell?
It would be nice if there was some empirical way to see if there have been more technological advancements recently than, say, 100 years ago.
After thinking about this idea for a while, I realized there was a way - patents. I could make the assumption that more patents mean more inventions, which would correlate to faster technological advancement.
My Source of Data
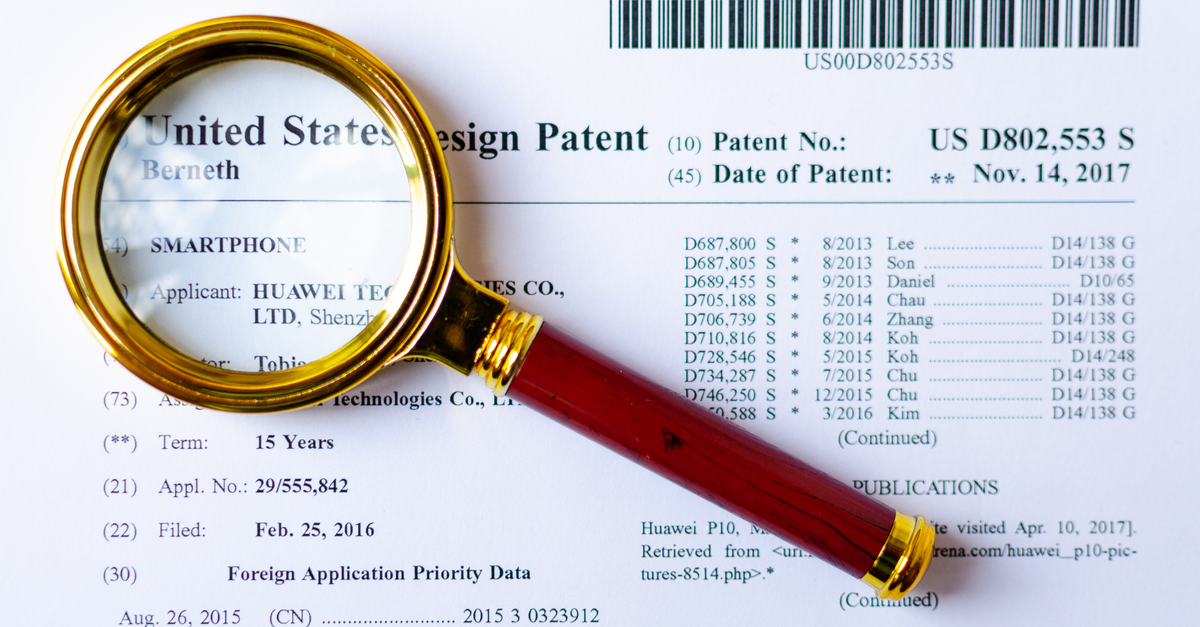
For this, I only looked at US patents since 1836. June 13, 1836, to be exact.
That’s when US Patent #1 was issued.
But wait, didn’t the US come to be in 1776? The current US Government and the current Federal government came to be in 1789. Shouldn’t the first US patent be issued sometime in either 1776 or 1789?
There were patents issued before 1836, however, there was a fire at the U.S. Patent Office destroying much of these patent records.
So I looked at (almost) every patent record from patent 1 in 1836 to patent 10,709,051 in 2020.
Oh, and if you can’t tell by the links, I got my data from Google Patents.
Almost Every Patent?
10,709,051 is a lot of patents to go through. Each patent took roughly half a second to process.
That means, if I wanted to process every patent, it would take almost 62 days to process:
( 0.5 seconds &mult; 10,709,051 patents ) * ( 1 day / 60 &mult; 60 &mult; 24 seconds) = 61.97367 days
Instead, I only wanted to process a subset of patents. I decided to skip every 97,355 patents. That is, I would first look at patent 1, then I would look at patent 97,356 (i.e. 1 + 97,355), then I would look at patent 194,711 (i.e. 97,356 + 97,355), and so on until I reached the final patent, patent 10,709,051.
Here’s my reasoning.
I wanted to average at least one patent a day. Ignoring leap days, there are 67,160 days from 1836 to 2020.
(2020 - 1836) * 365 = 67,160
If I divide 10,709,051 by 67,160 gets me somewhere around 159. Not exactly, but close.
So why did I choose 97,355 instead of 67,160?
If I start at 1 and keep adding 67,160, I’ll never read the final patent. Instead, I’ll only get to patent 10,678,441, issued in 2016.
What I want to do is add numbers such that I’ll reach 10,709,051. In other words, I need to add a divisor of one less than 10,709,051.
A divisor of 10,709,050.
Fortunately, I don’t have to figure out what those numbers are - WolframAlpha figured out the divisors of 10,709,050 for me:
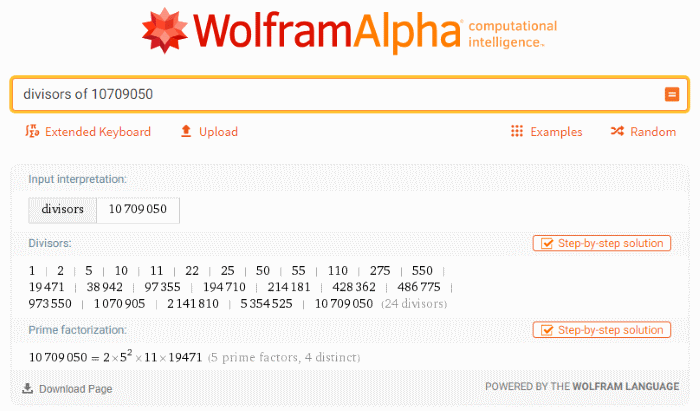
The two closest numbers to 67,160 are 38,942 and 97,355. 97,355 just felt “better” to me.
The Code
The Excel Spreadsheet
You may have noticed in the above code that I saved the results in a CSV format with the columns count, year, month, and day.
count is just the patent number.
I saved year, month, and day, month, and day into separate columns instead of a single date columns because Excel cannot parse dates earlier than 1900.
Instead, I approximated the time of year in decimal format with the following equation:
date = year + (month - 1) / 12 + day / 30
For the plots, I used scatter plots. For the patents per year, I used pivot tables.
Oh, and here’s a link the the Excel sheet.
Results
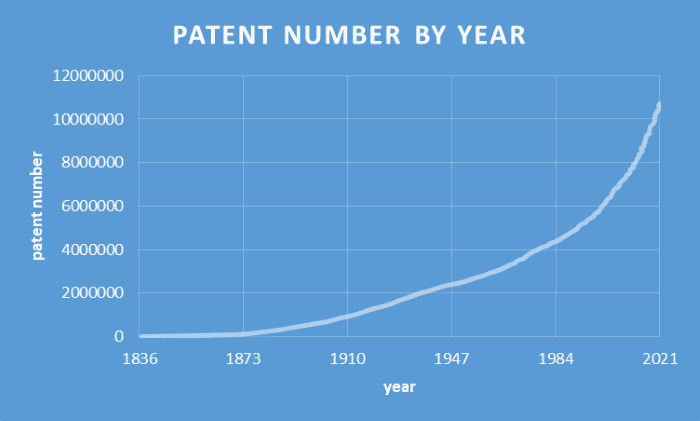 Patent Number by Year
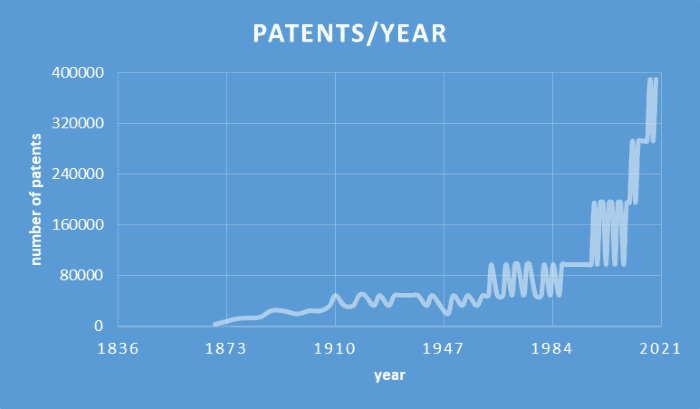 Patents per Year
There is an issue with patents per year. Since I’m skipping every 97,355 patents, I skip many years, especially early on, and even more so with the first 33 years of patents - my second patent record is patent 97,356 from 1869](https://patents.google.com/patent/US97356).
Also, there is a potential that the only patent record that I grab for a given year is from early in the year, skewing the patents for that year low. Indeed, the only patents I grabbed for 1884, 1905, 1908, 1916, 1928, 1948, 1960, 1962, and 1980 were from the month of January. That’s nine years that will definitely skew low.
Keep in mind that I grabbed only 82 different years. This means 9/82 or almost 11% of the years I grabbed only had January data.
Further Work
There are at least two ideas that could warrant further research.
The first is to improve my “patents per year” chart by using the last patent of each year - the actual final last patent, not the last patent I scraped.
Since the patent records don’t seem to be queryable by date, this may require some binary-like search algorithm to find the final date,
The second is to add other, potentially older, patent records to the dataset. At the time of this writing, Google Patents currently has “over 120 million patent publications from 100+ patent offices around the world”.
Adding non-US patent records could pose a couple of problems. First, there may be duplicate patents - the same invention, by the same inventor, may be patented in more than one jurisdiction. Second, the addition of overlapping patent records may result in anomalous “upticks” in patent numbers. Normalization would be required to level out said upticks.
Leave a Reply