Over Two Years of Recording my Calories & Weight
This site utilizes Google Analytics, Google AdSense, as well as participates in affiliate partnerships with various companies including Amazon. Please view the privacy policy for more details.
For the past 829 days, I’ve been recording my calories - what I’ve eaten and what exercises I’ve done - in MyFitnessPal. I’ve also been recording my weight almost every Monday, Wednesday, and Friday.
With over two years of data I was wondering what insights I could gleam from it. Are there any patterns I can find?
First, the Data
Here’s a graph of my weight over the past two plus years - from November 8, 2021 to February 12, 2024:
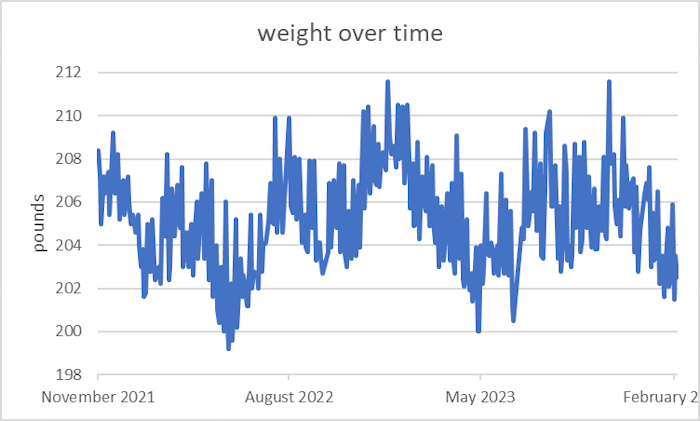
Plenty of ups & downs, fluctuating between 199 and 212 pounds while averaging about 205 pounds.
And then my “net calories” over time. “Net calories” in my case is food calories minus exercise calories. It does not include (or subtract) basal metabolic rate.
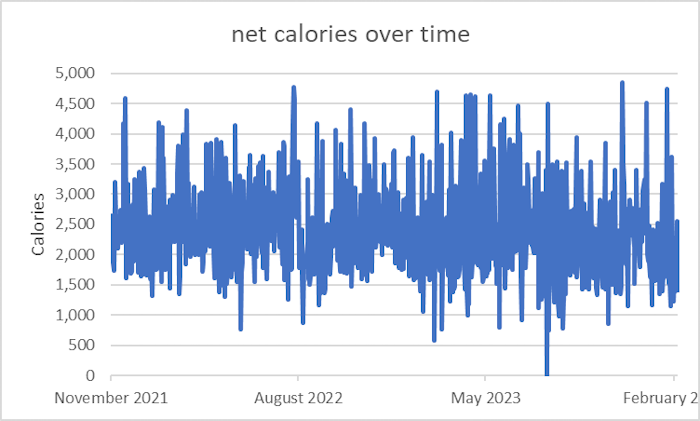
This value fluctuates between -107 and 4,850 calories with an average of 2332 calories. (That -107 measurement probably came from an overestimate of exercise calories. On August 5, 2023, I recorded consuming 2,508 calories of food while exerting 2,615 calories in exercise).
If you want to see the raw data, it’s available at the GitHub repository.
Next, Finding Patterns
The first thing I wondered was if there was any correlation between net calories and any change in my weight.
To figure this out, I had to massage the data in two ways.
One - the easiest - was convert my weight measurements into change in weight measurements. That just means subtracting each weight measurement from the previous weight measurement. That also means it reduces my data points by one - if I have n weight measurements, I will only have n-1 changes in weight.
Two, I had to somehow reduce the number of net calorie measurements. In order to find a correlation value, I needed to have to datasets of identical size. To do this, I took the average value of the net calories between two weight measurements - from the first weight measurement (inclusive) to the second weight measurement (exclusive). That means if I have a weight measurement on Monday and Wednesday, I’d take the net calories from Monday and Tuesday, add them together, and then divide by two. Why not also Wednesday? Two reasons - I don’t want to double-count any net calorie measurements, and I weight myself first thing in the morning before consuming or exerting calories.
Charted, these massaged values look like:
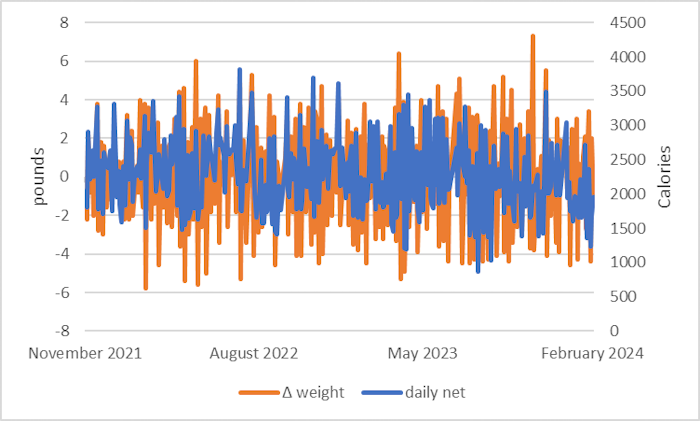
No super obvious visual correlation, but if I use Excel’s CORREL function, I’m told they have about a 60% correlation.
Further curious, I wondered what it would look like if I grouped the average daily net calories by whether they preceded weight gains or weight losses.
This is what the graph looked like when I did that:
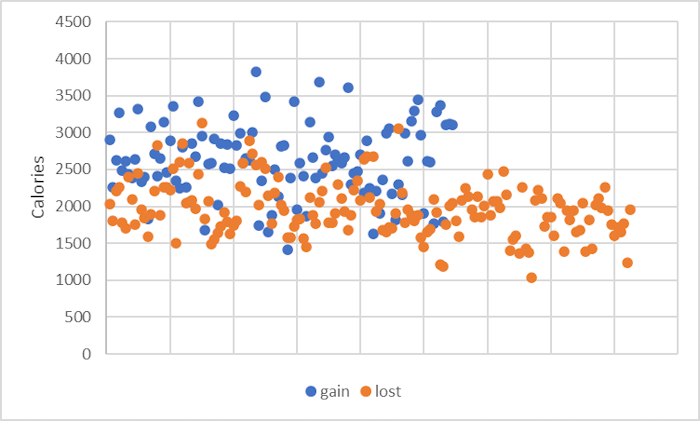
The x-axis in this case is mostly meaningless (I think it might be time, but the time when x = 1 for gain is not the same as for loss). It does look like the values for gaining weight are higher.
To be sure, I ordered both datasets by smallest to largest:
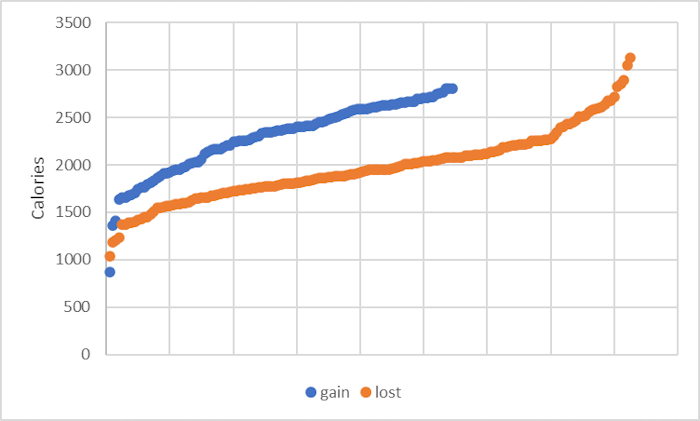
Again, the x-axis is mostly meaningless. In this case, the smallest values are towards x = 0.
This time, though, it’s clear that I tend to gain weight when I net more calories.
Interestingly, on average (mean) I gained weight when I netted 2,543 calories, and lost weight when I netted, on average, 1,967 calories.
Here’s a table of the mean and median values:
| gain | loss | midpoint | |
|---|---|---|---|
| mean | 2,543 | 1,967 | 2,255 |
| median | 2,585 | 1,946 | 2,265.5 |
Day of the Week
I also wondered what day of the week I tended to gain weight (and, conversely, what days I lost).
Previously I said I only recorded my weight on Monday, Wednesday, and Friday. I double-checked, and that’s mostly true:
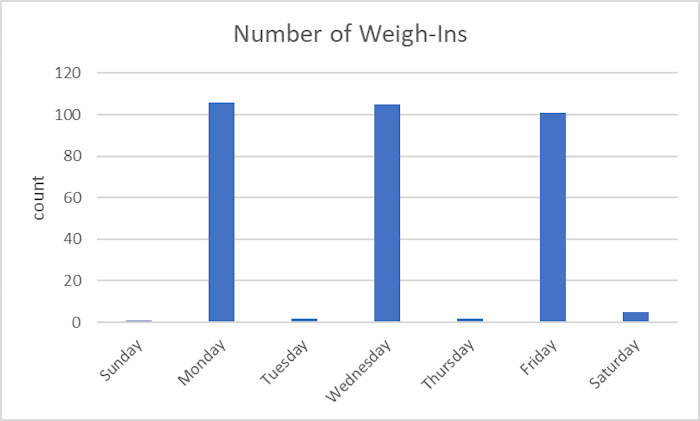
There were a few times I recorded my weight on days other than Monday, Wednesday, or Friday, but the vast majority were on those days.
Not worrying about those other days, I grouped the gains and losses for Monday, Wednesday, and Friday:
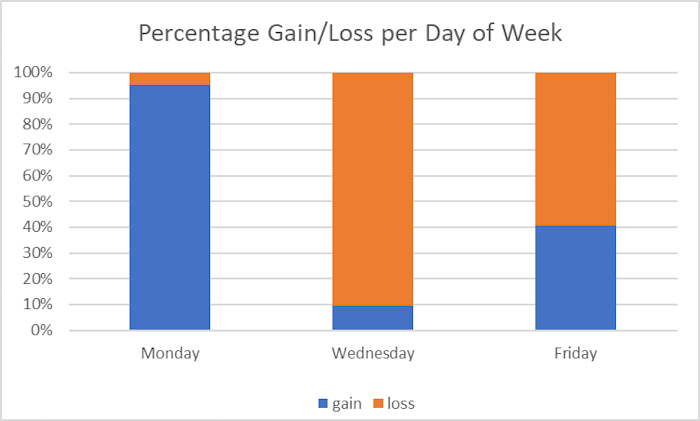
I’m not surprised that Monday has mostly weight gains. After all, it’s immediately after the weekend. I am a bit surprised at the amount of weight gains on Friday - I thought it would be almost the opposite of Monday.
Here’s the raw data in table form:
| gain | loss | total | |
|---|---|---|---|
| Sunday | 1 | 0 | 1 |
| Monday | 101 | 5 | 106 |
| Tuesday | 2 | 0 | 2 |
| Wednesday | 10 | 95 | 105 |
| Thursday | 0 | 2 | 2 |
| Friday | 41 | 60 | 101 |
| Saturday | 2 | 3 | 5 |
| total | 157 | 165 | 322 |
Failure: Trying to Calculate my Basal Metabolic Rate
To figure out my basal metabolic rate, or BMR, I came up with the following equation:
(net calories - BMR) × conversion factor = Δ weight
That is, my net calories (food calories minus exercise calories, averaged for the number of days) minus my BMR, multiplied by some conversion factor, would equal my change in weight.
Since that equation has two variables I don’t have (namely, the BMR and the conversion factor) I would need two data points to figure out the value. That is, I would find the intersection of two of those equations.
So I figured it out for every pair of weight changes I had. Sometimes I got a reasonable number for BMR - like 2,288 calories on January 19, 2022.
But I also got a fair amount of negative numbers (how can I have a negative BMR?) or even numbers as high as 1,073,741,823 (over a billion!).
I did graph the “reasonable” numbers - those BMRs I calculated that were between 1,000 calories and 3,000 calories:
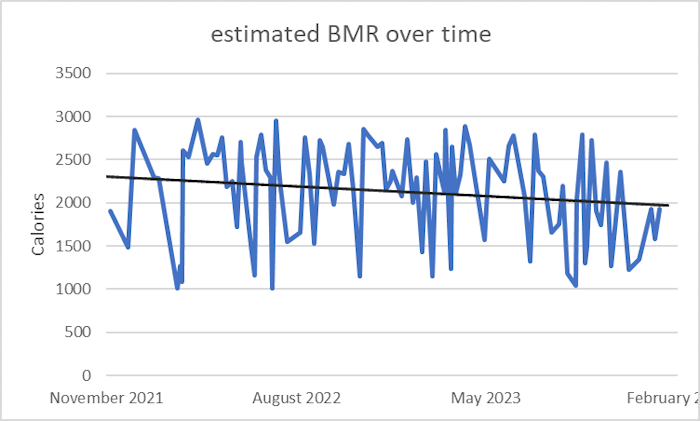
I was mostly curious as to the trend of my BMR over time - hence the trend line in the graph above. And that trend line does show it decreasing. But that involved throwing away 229 of the 331 values I calculated, leaving me a little less than a third of the data points.
Throwing away that much data feels too much like cherry-picking to be confident on the results.
GitHub Repository
The code for this is available over at https://github.com/hendrixjoseph/tdee. Most of the code is written in Java, however, I used Tampermonkey scripts, written in JavaScript, to extract the data from MyFitnessPal.
I also used Excel to make the graphs and help organize the data.
Leave a Reply