
Using Linear Regression to Analyze My Electric Bill
This site utilizes Google Analytics, Google AdSense, as well as participates in affiliate partnerships with various companies including Amazon. Please view the privacy policy for more details.
Here in Ohio we can choose our electric supplier… But not who delivers it.
I suppose that makes sense. The “natural monopoly” argument for this is that it doesn’t make sense to have multiple telephone poles with multiple wires going into houses. That might be a mess.
I’ve chosen my own supplier - check out my post where I visualized my electric energy options - so I know what my supplier rate is.
But what about my delivery rate? It’s not constant. It goes up when I use more, and down when I use less.
There is a constant “customer charge” on my bill each month of $9.75. That means my bill can never be lower than nine-bucks-and-three-quarters.
So, wondering what exactly the delivery rate is, I looked at my bills for this year and put them into a table:
| month | kWh | bill | customer | delivery | supply | rate |
|---|---|---|---|---|---|---|
| July | 652.31 | $129.99 | $9.75 | $59.25 | $60.99 | $0.0935 |
| June | 324.53 | $71.13 | $9.75 | $31.04 | $30.34 | $0.0935 |
| May | 303.68 | $65.17 | $9.75 | $27.03 | $28.39 | $0.0935 |
| April | 344.08 | $72.20 | $9.75 | $30.28 | $32.17 | $0.0935 |
| March | 343.60 | $79.49 | $9.75 | $31.29 | $38.45 | $0.1119 |
| February | 455.44 | $82.73 | $9.75 | $40.23 | $32.75 | $0.0719 |
| January | 499.60 | $89.44 | $9.75 | $43.77 | $35.92 | $0.0719 |
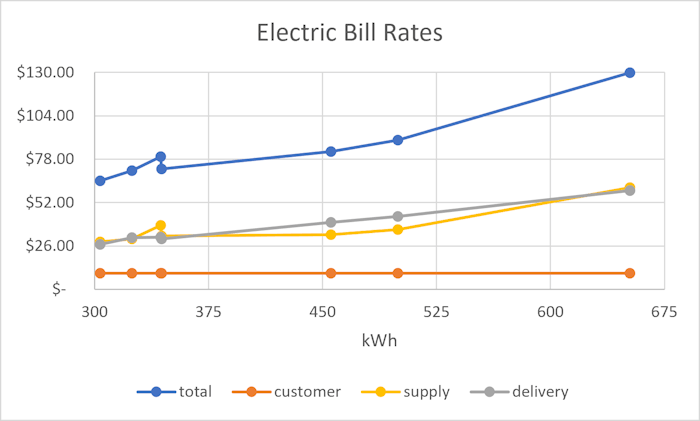 I also made this connected scatterplot
First, I checked the accuracy of the bills - did the customer charge plus the delivery charge plus the supply charge equal the total? Did the kilowatt usage times the rate equal the supply charge? Thankfully, it did, so I didn’t need to make any phone calls about my bill.
Next, I took each month’s delivery charge and divided it by the kilowatt-hour usage - I was curious if the rate was constant or if it varied. It turns out that the value was not constant:
| month | delivery | kWh | delivery/kWh |
|---|---|---|---|
| July | $59.25 | 652.31 | $0.0908 |
| June | $31.04 | 324.53 | $0.0956 |
| May | $27.03 | 303.68 | $0.0890 |
| April | $30.28 | 344.08 | $0.0880 |
| March | $31.29 | 343.60 | $0.0911 |
| February | $40.23 | 455.44 | $0.0883 |
| January | $43.77 | 499.60 | $0.0876 |
The delivery cost does go up with the kilowatt-hour usage, so I wanted to see if it could be approximated by a simple linear equation. To do that, I used Excel’s INTERCEPT and SLOPE functions to find the y-intercept and slope for each of the dollars amounts over the kilowatt usage.
In other words, I found the values m and b for the standard linear equation y = mx + b. y-values are dollars, x-values are kilowatt-hours.
Excel gave me an intercept of $0.46 and a slope of $0.0888/kWh. That means Excel was suggesting a linear equation of y = 0.0888 x + 0.46.
I plugged each month’s usage into that equation for each month, and, while the numbers were close, they weren’t close enough to explain how my delivery charge was determined:
| month | real delivery | linear estimate | difference |
|---|---|---|---|
| July | $59.25 | $58.40 | $(0.85) |
| June | $31.04 | $29.29 | $(1.75) |
| May | $27.03 | $27.44 | $0.41 |
| April | $30.28 | $31.02 | $0.74 |
| March | $31.29 | $30.98 | $(0.31) |
| February | $40.23 | $40.92 | $0.69 |
| January | $43.77 | $44.84 | $1.07 |
(To make sure I was using the INTERCEPT and SLOPE functions correctly, I also used them to determine the linear equations for the constant customer charge and those months that had a supply rate of $0.0935; it correctly told me that the linear equation for the customer charge rate is y = 0 x + 9.75 and the linear equation for the supply for those specific months is y = 0.0935 x + 0.)
So what determines the delivery charge? The only thing I’ve learned here is that my delivery charge is correlated to my energy usage - the more kilowatt-hours I use, the higher my delivery charge (in fact, using Excel’s CORREL function returns a correlation value of 0.9959 - nearly 1). According to AES Ohio’s Residential Delivery Charges section of that webpage (scroll to the bottom if it doesn’t link directly to it) the delivery charge has a customer charge of $9.75 (which my bill does have) and a base distribution rate of $0.049/kWh (which my bill is almost twice that amount).
Apparently there’s additional “riders” on top of the base distribution rate, although I’m not sure what. Figuring out those riders may be a project for another day.
Leave a Reply
