
Venn Diagrams of Various Vanguard Funds
This site utilizes Google Analytics, Google AdSense, as well as participates in affiliate partnerships with various companies including Amazon. Please view the privacy policy for more details.
It started with a simple question. Does Vanguard’s Total Stock Market Fund include REITs?
It ended with checking the overlap of four different classes of Vanguard funds (and five funds total).
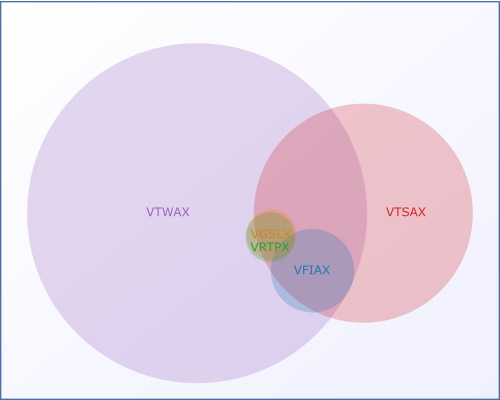
These funds? The Vanguard 500 Index Fund (VFIAX), the Vanguard Real Estate Index Fund (VGSLX), the Vanguard Real Estate II Index Fund (VRTPX), the Vanguard Total Stock Market Index Fund (VTSAX), and the Vanguard Total World Stock Index Fund (VTWAX).
And what better way to see the overlap of these funds than with Venn Diagrams?
But before I present those beautiful, beautiful diagrams, let me lay down the methodology and some code. Feel free to skip to the results if you want.
(By the way, the answer to the question “Does Vanguard’s Total Stock Market Fund include REITs?” is “Yes.”)
Methodology
I assumed that each fund in the index fund was equally weighted. That is, I was only concerned with the holdings, not the size of the holdings.
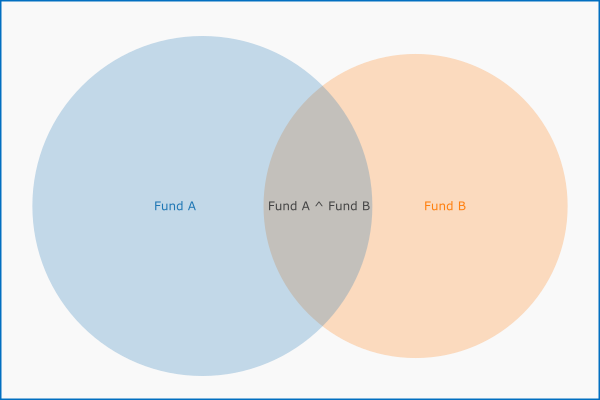
For instance, say I had a fund we’ll call unimaginatively Fund A that consists of five stocks: Stock A, Stock B, Stock C, Stock D, and Stock E. That fund has a size of five - because five stocks.
Now we have another stock that’s called - you guessed it - Fund B. It has four stocks - Stock E, Stock F, Stock G, and Stock H. It has a size of four - again, because it has four stocks.
Now we’ll look at the intersection of these two funds. This intersection contains all the stocks - and only the stocks - the two funds have in common. We’ll call this fund “Fund A ^ Fund B”. “^” being the symbol you normally get by typing shift-6.
This fund has one stock in it - Stock E. Therefore, this intersection fund - Fund A ^ Fund B - has one stock in it.
So my data for these hypothetical funds looks like the following:
| Fund | Size |
|---|---|
| Fund A | 5 |
| Fund B | 4 |
| Fund A ^ Fund B | 1 |
And consequently, the Venn Diagram would look like the following:
The Code
Getting the fund holdings wasn’t as straightforward as I would’ve liked. Vanguard does publish them on their website, however, it’s paginated - with thirty funds per page.
The largest fund I looked at - VTWAX - has 8450 holdings. Meaning there are 282 pages of funds. Way too much to copy and paste manually.
So I made a Tamper Monkey script to scrape the fund contents for me:
// ==UserScript==
// @name         Vanguard Market Scraper
// @namespace    https://www.joehxblog.com
// @version      0.1
// @description  try to take over the world!
// @author       You
// @match        https://investor.vanguard.com/mutual-funds/profile/overview/*/portfolio-holdings
// @grant        none
// ==/UserScript==

(function() {
    'use strict';

    let component =
    `<div id="hj-div" style="position: fixed; top: 100px; left: 10px;">
     <button id="hj-scrape" style="display: block;padding: 0.5em;height: inherit;">Scrape</button>
     </div>`

    $("body").append(component);

    $("#hj-scrape").click(() => {
        let array = [];

        let nextButton = "a[data-ng-click='goToNextPage()']";
        let dataRow = "table.scrollingTableLeft tr td.fixedCol";

        let read = (index, value) => {
                let text = $(value).text().trim();

                array.push(text);
            };

        while(!$(nextButton).hasClass("inActiveLink")) {
            $(dataRow).slice(0,30).each(read);
            $(nextButton).first().click();
        }

        $(dataRow).slice(0,30).each(read);

        let filecontents = array.reduce((total, item) => total + item + "\n");
        let filename = window.location.pathname
                             .replace("/mutual-funds/profile/overview/", "")
                             .replace("/portfolio-holdings", "")
                             + ".txt";

        let givemeabreak = document.createElement('br');
        let hiddenElement = document.createElement('a');
        hiddenElement.href = 'data:text/csv;charset=utf-8,' + encodeURI(filecontents);
        hiddenElement.target = '_blank';
        hiddenElement.download = filename;
        hiddenElement.textContent = filename;
        $("#hj-div").append(hiddenElement);
        $("#hj-div").append(givemeabreak);

        console.log(array);
        console.log(filecontents);
    });
})();
To compute the intersections, I wrote a two-class Java program using Google Guava’s Sets utility class.
I only needed two methods - Sets.intersection and Sets.powerSet. The first I used to find, well, the intersections, and the second I used to find all combination of funds.
The two classes I wrote are both available on GitHub, but for completeness sake, they are also listed below:
FundVenn.java
package hendrixjoseph;

import java.io.File;
import java.util.Arrays;
import java.util.HashSet;
import java.util.Set;
import java.util.stream.Collectors;

import com.google.common.collect.Sets;

public class FundVenn {
    public static void main(String... strings) {

        var vanguardVenn = new FundVenn("data/");
        var sets = vanguardVenn.compute();

        sets.stream()
            .sorted((fund1, fund2) -> fund1.name.compareTo(fund2.name))
            .sorted((fund1, fund2) -> fund1.name.length() - fund2.name.length())
            .forEach(System.out::println);
    }

    Set<Fund> funds = new HashSet<>();

    public FundVenn(String dataDir) {
        this(new File(dataDir));
    }

    public FundVenn(File dataDir)  {
        funds.addAll(readFiles(dataDir.listFiles()));
    }

    public Set<Fund> readFiles(File[] files) {
        return Arrays.stream(files)
                     .map(Fund::new)
                     .collect(Collectors.toSet());
    }

    public Set<Fund> compute() {
        Set<Set<Fund>> combos = Sets.powerSet(funds);

        return combos.stream()
                     .filter(funds -> funds.size() > 0)
                     .map(Fund::new)
                     .collect(Collectors.toSet());
    }
}
Fund.java
package hendrixjoseph;

import java.io.File;
import java.io.IOException;
import java.nio.file.Files;
import java.util.Collections;
import java.util.HashSet;
import java.util.Set;
import java.util.stream.Collectors;

import com.google.common.collect.Sets;

public class Fund {
    Set<String> assets = new HashSet<>();
    String name;

    public Fund(Set<Fund> funds) {
        this(comboName(funds), intersectFunds(funds));
    }

    public Fund(File file) {
        this(trimFilename(file), readFile(file));
    }

    private static Set<String> intersectFunds(Set<Fund> funds) {
        return funds.stream()
                    .map(fund -> fund.assets)
                    .reduce((soFar, thisOne) -> Sets.intersection(soFar, thisOne))
                    .get();
    }

    private static String comboName(Set<Fund> funds) {
        return funds.stream()
                    .map(Fund::getName)
                    .sorted((name1, name2) -> name1.compareTo(name2))
                    .reduce((newName, name) -> newName + " ^ " + name)
                    .get();
    }

    private static Set<String> readFile(File file) {
        try {
            return Files.readAllLines(file.toPath())
                        .stream().filter(string -> !string.isEmpty())
                        .map(string -> string.replaceAll(" Class .+$", ""))
                        .collect(Collectors.toSet());
        } catch (IOException e) {
            e.printStackTrace();
            return Collections.emptySet();
        }
    }

    private static String trimFilename(File file) {
        return file.getName().replaceAll("\\.txt$", "").toUpperCase();
    }

    public Fund(String name, Set<String> assets) {
        this.name = name;
        this.assets.addAll(assets);
    }

    public int size() {
        return this.assets.size();
    }

    public String getName() {
        return this.name;
    }

    @Override
    public String toString() {
        return this.name + " " + this.size();
    }
}
To generate the charts, I manually entered the data into an online Venn Diagram Maker. This was somewhat tedious, so if I do any more analysis I may have to automate this process, so if you know of a decent Java Venn Diagram generator let me know in the comments at the bottom of this post.
The Data and the Venn Diagrams
This is the results of the first run:
| Fund | Size |
|---|---|
| VFIAX | 507 |
| VGSLX | 182 |
| VRTPX | 179 |
| VTSAX | 3489 |
| VTWAX | 8404 |
| VFIAX ^ VGSLX | 30 |
| VFIAX ^ VRTPX | 29 |
| VFIAX ^ VTSAX | 471 |
| VFIAX ^ VTWAX | 506 |
| VGSLX ^ VRTPX | 178 |
| VGSLX ^ VTSAX | 165 |
| VGSLX ^ VTWAX | 143 |
| VRTPX ^ VTSAX | 162 |
| VRTPX ^ VTWAX | 142 |
| VTSAX ^ VTWAX | 1577 |
| VFIAX ^ VGSLX ^ VRTPX | 29 |
| VFIAX ^ VGSLX ^ VTSAX | 28 |
| VFIAX ^ VGSLX ^ VTWAX | 30 |
| VFIAX ^ VRTPX ^ VTSAX | 27 |
| VFIAX ^ VRTPX ^ VTWAX | 29 |
| VFIAX ^ VTSAX ^ VTWAX | 471 |
| VGSLX ^ VRTPX ^ VTSAX | 162 |
| VGSLX ^ VRTPX ^ VTWAX | 142 |
| VGSLX ^ VTSAX ^ VTWAX | 132 |
| VRTPX ^ VTSAX ^ VTWAX | 131 |
| VFIAX ^ VGSLX ^ VRTPX ^ VTSAX | 27 |
| VFIAX ^ VGSLX ^ VRTPX ^ VTWAX | 29 |
| VFIAX ^ VGSLX ^ VTSAX ^ VTWAX | 28 |
| VFIAX ^ VRTPX ^ VTSAX ^ VTWAX | 27 |
| VGSLX ^ VRTPX ^ VTSAX ^ VTWAX | 131 |
| VFIAX ^ VGSLX ^ VRTPX ^ VTSAX ^ VTWAX | 27 |
I noticed that in some of the funds there were “Class A Stocks”, “Class B Stocks”, and so on that might affect the intersection of the funds, so I ran the code again removing the “Class _” part of the stock names:
| Fund | Size |
|---|---|
| VFIAX | 500 |
| VGSLX | 181 |
| VRTPX | 179 |
| VTSAX | 3476 |
| VTWAX | 8294 |
| VFIAX ^ VGSLX | 30 |
| VFIAX ^ VRTPX | 29 |
| VFIAX ^ VTSAX | 495 |
| VFIAX ^ VTWAX | 499 |
| VGSLX ^ VRTPX | 178 |
| VGSLX ^ VTSAX | 177 |
| VGSLX ^ VTWAX | 143 |
| VRTPX ^ VTSAX | 175 |
| VRTPX ^ VTWAX | 142 |
| VTSAX ^ VTWAX | 1701 |
| VFIAX ^ VGSLX ^ VRTPX | 29 |
| VFIAX ^ VGSLX ^ VTSAX | 30 |
| VFIAX ^ VGSLX ^ VTWAX | 30 |
| VFIAX ^ VRTPX ^ VTSAX | 29 |
| VFIAX ^ VRTPX ^ VTWAX | 29 |
| VFIAX ^ VTSAX ^ VTWAX | 495 |
| VGSLX ^ VRTPX ^ VTSAX | 175 |
| VGSLX ^ VRTPX ^ VTWAX | 142 |
| VGSLX ^ VTSAX ^ VTWAX | 142 |
| VRTPX ^ VTSAX ^ VTWAX | 141 |
| VFIAX ^ VGSLX ^ VRTPX ^ VTSAX | 29 |
| VFIAX ^ VGSLX ^ VRTPX ^ VTWAX | 29 |
| VFIAX ^ VGSLX ^ VTSAX ^ VTWAX | 30 |
| VFIAX ^ VRTPX ^ VTSAX ^ VTWAX | 29 |
| VGSLX ^ VRTPX ^ VTSAX ^ VTWAX | 141 |
| VFIAX ^ VGSLX ^ VRTPX ^ VTSAX ^ VTWAX | 29 |
There is one last error I didn’t fully correct - when I scraped the data, the first two stocks scraped ended up on the same (first) line making them appear as one stock.
Any Other Funds I Should Try?
Are you curious as to what the intersection of any other funds is? Let me know in the comments below and I might write another post with new analysis.
4 comments for Venn Diagrams of Various Vanguard Funds
Leave a Reply

Very cool, can you include VTIAX as well? Interested in seeing the VTSAX/VTIAX/VTWAX comparison
Totally. I’ll probably remove one of VGSLX or VRTPX (the REIT funds) when I do, since they overlap so much.
Reply to This Thread
That was interesting & fun to see the venn diagram. However, all the coding seemed like WORK! 🤣
Yeah, it was a bit of work, but I enjoyed doing it nevertheless :)
Reply to This Thread