August 2019 Blog Statistics
This site utilizes Google Analytics, Google AdSense, as well as participates in affiliate partnerships with various companies including Amazon. Please view the privacy policy for more details.
It’s time for the twentieth blog stat report on the twentieth of the month!
My first blog stat report was on January 2018. Four more months and I’ll have two year’s worth of these reports.
This month’s report will be interesting due to the change in domain. It turns out that it only affected two of the tools I use - namely Alexa (which ranks domains) and Google Webmaster Tools.
I was able to publish five posts this month:
- Rebrand Part II: Changing My Domain Name
- Rebrand: From Joe’s GitHub Blog to JoeHx Blog
- July 2019 Book Reading List
- Introducing AutoPhotoSync for Google Photos
- First Half 2019 POD & T-Shirt Sales Report
Alexa
Alexa has data for both the old hendrixjoseph.github.io domain and the new joehxblog.com domain:
Alexa Ranking for the old hendrixjoseph.github.io
- Global Rank → 369,854
- Rank in the United States → 65,104
- Total Sites Linking In → 58
Alexa Ranking for the new joehxblog.com
- Global Rank → 868,422
- Rank in the United States → 96,362
- Total Sites Linking In → 0 (stat absent)
Google Analytics
Since Google Analytics is dependent on a bit of JavaScript on the webpages, it was largely unaffected by the domain change.
- Sessions → 2,231
- Users → 1,949
- Pageviews → 2,954
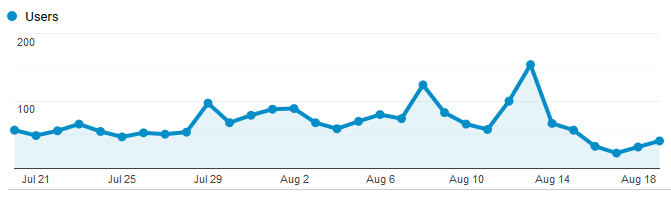 Google Analytics Graph for August
Google Search Console
Google Search Console (aka Google Webmaster Tools) is where things are looking interesting. If you look at the graph for hendrixjoseph.github.io compared to the graph for joehxblog.com, you’ll notice that performance for hendrixjoseph.github.io is tapering off whereas performance for joehxblog.com is gaining traction.
Google Search Console for hendrixjoseph.github.io
- Clicks → 1,280
- Search Impressions → 61,800
- Average position → 29.1
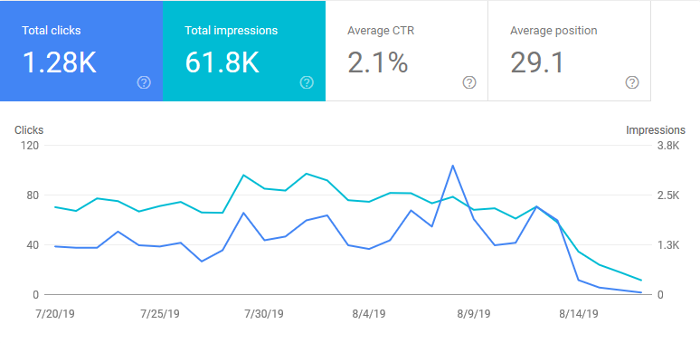 Google Search Console Graph for
hendrixjoseph.github.io in August
Google Search Console Graph for
hendrixjoseph.github.io in August
Google Search Console for joehxblog.com
- Clicks → 74
- Search Impressions → 1,620
- Average position → 43.6
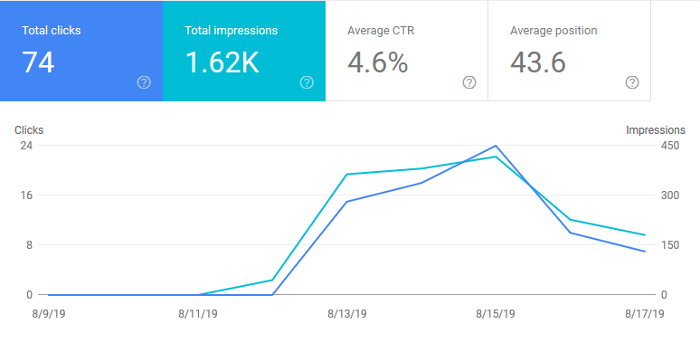 Google Search Console Graph for joehxblog.com in August
Sum of Stats for Google Search Console
I think it makes sense that I can combine “clicks” and “search impressions” for both properties. I don’t think it made sense to combine (or average) the stats for “average position,” however.
- Clicks → 1,354
- Search Impressions → 63420
AdSense
AdSense, like Google Analytics, is largely unaffected by the domain change, since it, too, is dependent by a bit of JavaScript I have injected on each page.
- Balance → $47.75
- Estimated earnings → $3.20
- Impressions → 1,464
- Clicks → 3
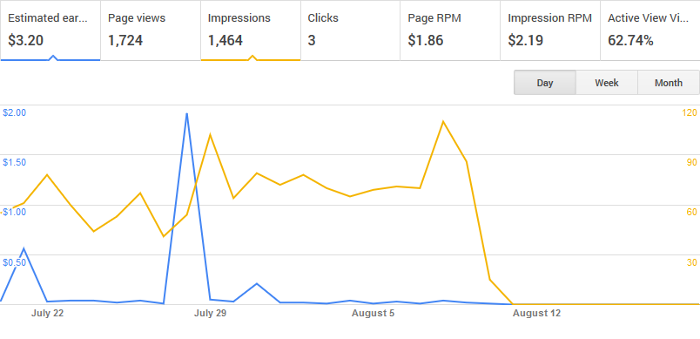 Google AdSense Graph for August
Ratios
- Earnings / 1,000 sessions = $3.20/ 2.231 = $1.43
- Earnings / 1,000 pageviews = $3.20 / 2.954 = $1.08
- Earnings / 1,000 impressions = $3.20 / 1.464 = $2.19
- Earnings / day = $3.20 / 31 = $0.10
- Sessions / day = 2,231 / 31 = 72.0
- Pageviews / day = 2,954 / 31 = 95.3
- Impressions / day = 1,464 / 31 = 47.2
Leave a Reply