
June 2021 Blog Statistics
June 20, 2021
This site utilizes Google Analytics, Google AdSense, as well as participates in affiliate partnerships with various companies including Amazon. Please view the privacy policy for more details.
It’s the twentieth. It’s time for another blog stats post.
Note that the charts won’t be updated for about a week - for now now they’ll just be broken images.
I wrote nine posts this month:
- Interesting Reads for the Week Ending June 18th
- Java Collections Framework - Set Interface Method Examples
- Interesting Reads for the Week Ending June 11th
- Interesting Reads for the Week Ending June 4th
- May 2021 Book Reading List
- Java Collections Framework - Map Interface Method Examples
- Interesting Reads for the Week Ending May 28th
- 2021 Brood X Cicada Emergence
- Java Collections Framework - List Interface Method Examples
The most posts I’ve ever written in a month were in July 2019 and September 2019 with eight posts in each month. I was really hustling back then.
I haven’t written any posts over on my campaign site.
Alexa
- Global Rank → 1,955,945
Google Analytics
However, my Google Analytics shows that I have consistant views:
- Sessions → 5,154
- Users → 4,611
- Pageviews → 6,083
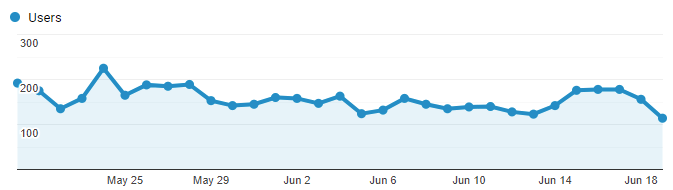
Google Analytics Graph for June
Google Search Console
- Clicks → 3,360
- Search Impressions → 104,000
- Average position → 30.8
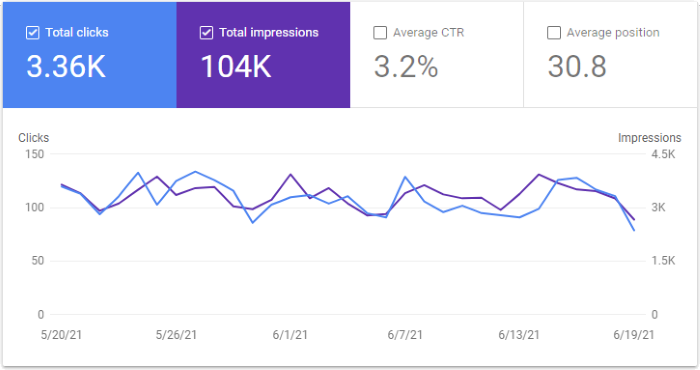
Google Search Console Graph for June
AdSense
- Balance → $114.33
- Estimated earnings → $98.65
- Impressions → 4,971
- Clicks → 169
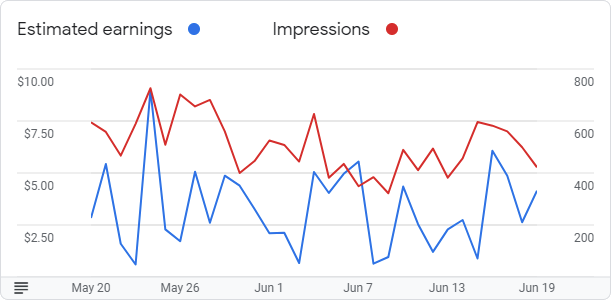
Google AdSense Graph for June
Moz Stats
- Moz Domain Authority → 32
- Moz Linking Domains → 497
Ratios
- Earnings / 1,000 sessions = $98.65 / 5.514 = $17.89
- Earnings / 1,000 pageviews = $98.65 / 6.083 = $16.22
- Earnings / 1,000 impressions = $98.65 / 4.971 = $19.85
- Earnings / day = $98.65 / 31 = $3.18
- Sessions / day = 5,514 / 31 = 166.3
- Pageviews / day = 6,083 / 31 = 196.2
- Impressions / day = 4,971 / 31 = 160.4
Leave a Reply

Thank you. Your comment will be visible after approval.
Your comment has been submitted, but their seems to be an error. Check your browser console for more details.